YouTube Analytics Explained: Key Metrics Every Creator Should Know
If you want to grow on YouTube, your content is only part of the equation. Understanding YouTube Analytics can help you see what is working, what needs improvement, and how viewers are interacting with your videos. Whether you are new to the platform or aiming to level up your channel, learning how to read and use your analytics is one of the smartest moves you can make.
Here is a beginner-friendly breakdown of the most important YouTube metrics — and how to use them.
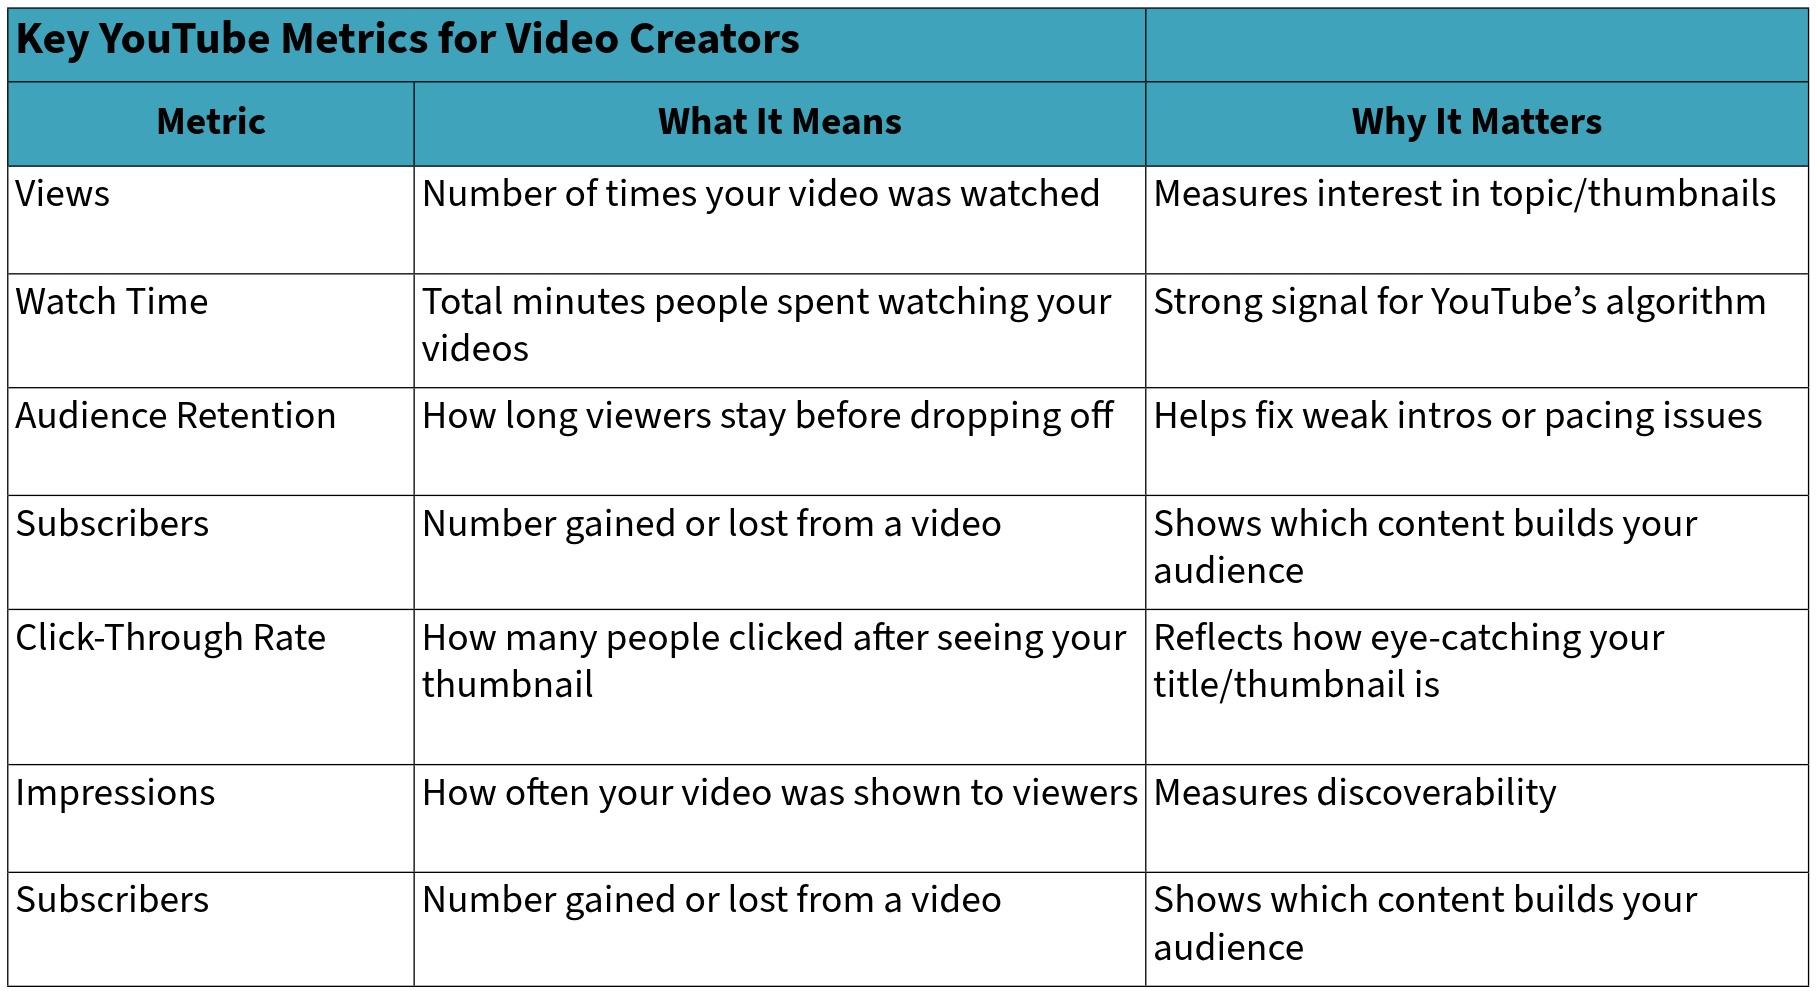
Chart of Key YouTube Analytics

Where to Find YouTube Analytics
To get started, go to YouTube Studio and click on the Analytics tab in the left-hand menu. You will see several sections: Overview, Content, Audience, Revenue, and more. Let’s focus on the essentials first.
1. Views
This is the total number of times people have watched your video. It is one of the easiest numbers to understand, but keep in mind that it does not show how long someone watched — just that they clicked.
✅ Use it to: See which topics or thumbnails are grabbing attention.
2. Watch Time
Watch time shows how many total minutes people have spent watching your content. It is one of YouTube’s most important signals for ranking videos. More watch time = better performance.
✅ Use it to: Measure how well your video holds interest overall.
3. Audience Retention
This metric shows what percentage of your video viewers are watching and where they drop off. If lots of people leave in the first 15 seconds, your intro may be too slow or confusing.
✅ Use it to: Improve your pacing and storytelling.
4. Click-Through Rate (CTR)
This shows how many people clicked on your video after seeing the thumbnail and title. A good CTR is usually between 2% and 10%, depending on your audience.
✅ Use it to: Test new thumbnails and video titles to see what gets the most clicks.
5. Impressions
Impressions tell you how many times your thumbnail was shown on YouTube (in search results, on the home page, or in recommended videos). You can compare impressions with CTR to see how well your content is attracting attention.
✅ Use it to: Understand how often YouTube is recommending your videos.
6. Subscribers
This shows how many subscribers you gained (or lost) from a specific video. Videos that bring in new subscribers are doing a great job connecting with your audience.
✅ Use it to: Figure out what kind of content makes people want to follow your channel.
Bonus Tip: Check Traffic Sources
In the “Reach” tab, you can see where your viewers are coming from — search, external links, the YouTube homepage, and more. Knowing your traffic sources helps you understand how people are finding your videos.
Final Thoughts
YouTube Analytics is not just a numbers game — it is a storytelling tool. Every chart and graph tells you something about how your audience thinks, feels, and behaves. Use this information to test new ideas, keep what works, and continue improving your content.
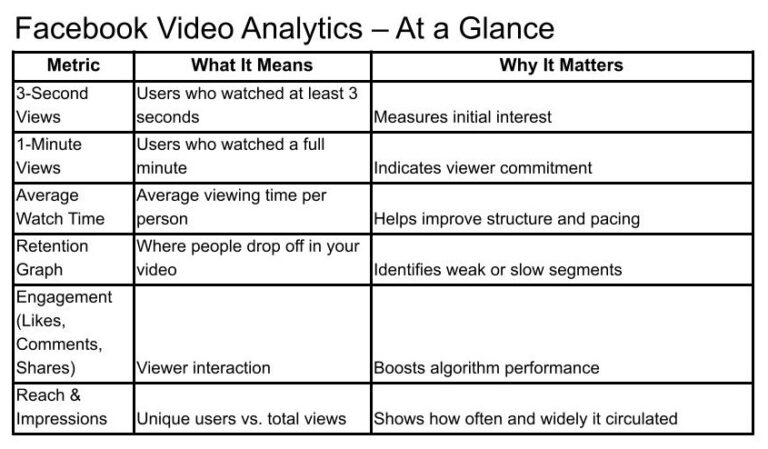
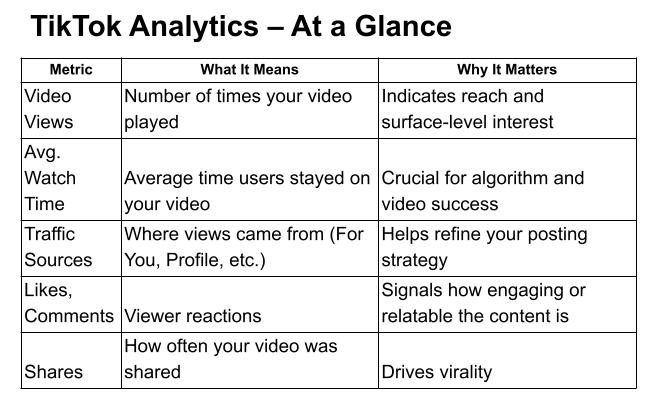
Stay tuned for the next article in this series, where we will explore TikTok Analytics and how to grow on one of the fastest-moving video platforms.